Loading Howl Media Labs
Preparing the page and animations...
Loading Howl Media Labs
Preparing the page and animations...
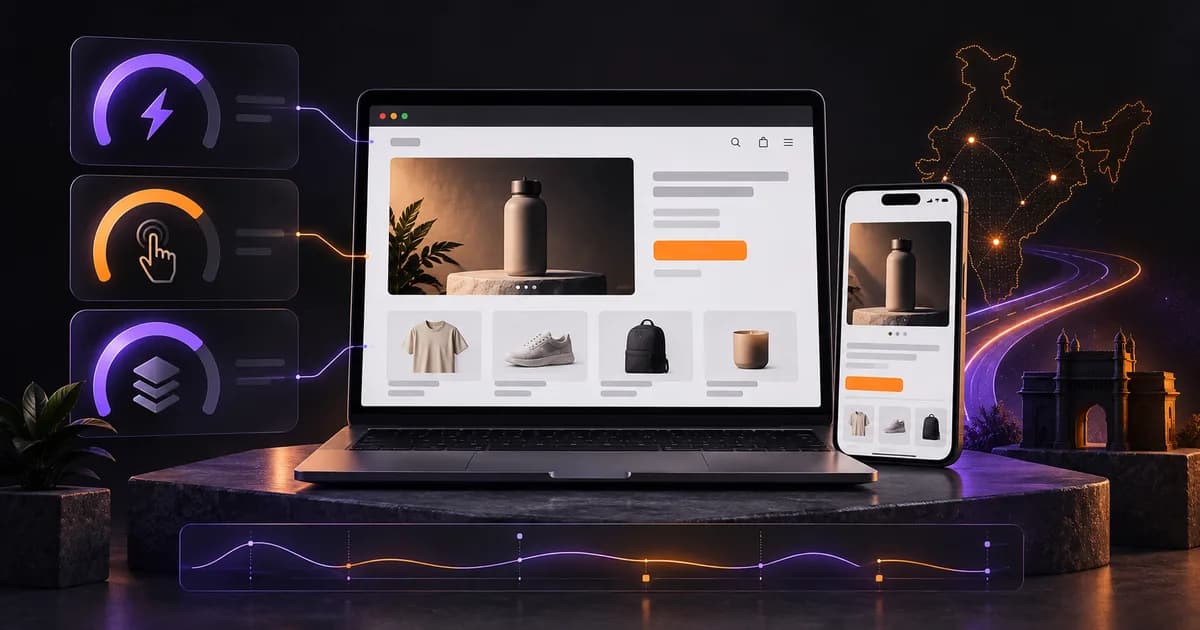
A Shopify Core Web Vitals audit should begin with mobile real-user data, not a single Lighthouse screenshot. Segment LCP, INP and CLS by page type, device and release events; prioritise the journeys with the most traffic and commercial exposure; reproduce each defect in the lab; ship one controlled change; and verify the result in field data and conversion metrics.
Core Web Vitals describe three different parts of a shopper's experience:
| Metric | What it represents | Good threshold at the 75th percentile | Typical Shopify symptom | | --- | --- | ---: | --- | | Largest Contentful Paint (LCP) | When the main visible content finishes rendering | 2.5 seconds or less | Hero or product image appears late | | Interaction to Next Paint (INP) | How quickly the page responds visibly to interactions | 200 milliseconds or less | Variant, menu or add-to-cart action feels stuck | | Cumulative Layout Shift (CLS) | Unexpected movement of visible content | 0.1 or less | Price, app widget or image moves after load |
Google's threshold methodology applies these classifications at the 75th percentile of page views. That percentile matters: an average can hide the slower experience affecting a meaningful share of mobile shoppers.
Do not combine the three metrics into one homemade “speed score.” A store can load its product image quickly and still have a slow variant selector. Each failure needs a different diagnosis and owner.
Complete site live in 4–5 weeks
See how we shipped a complete tourism site in 4–5 weeksRead it →
Use all three for different jobs.
Shopify's performance-testing documentation says its Web Performance Dashboard uses Real User Monitoring data from store visitors and can break performance down by page type, device category and geography. This is the strongest starting point for understanding what shoppers experienced.
PageSpeed Insights can show Chrome UX Report field data when the URL or origin has enough eligible traffic. Lighthouse creates a controlled lab run that is useful for reproducing a problem, examining the network waterfall and comparing code changes.
Google's explanation of lab and field differences is explicit: the two datasets measure different conditions. Field data includes varied devices, networks, caches and behaviours; lab data uses predefined conditions. A green lab run does not cancel a poor field result, and one red lab run does not prove most customers had a poor visit.
Use this decision order:
Do not begin with the easiest template. Weight page types by business exposure.
| Page type | Commercial question | Common performance risk | | --- | --- | --- | | Product | Can a shopper evaluate and add the right variant? | Large gallery media, reviews, recommendations, subscriptions | | Collection | Can a shopper scan and filter without delay? | Filter scripts, oversized cards, quick-add components | | Cart or drawer | Can intent progress without hesitation? | Upsells, shipping estimators, app-injected content | | Home | Can new visitors understand the offer quickly? | Autoplay video, carousels, animation and multiple trackers | | Content and landing pages | Can paid or organic visitors reach proof and the next action? | Page-builder bundles, embeds and late fonts |
Shopify's theme performance guidance highlights mobile constraints and recommends avoiding a lazy-loaded LCP image, using high fetch priority for that image, keeping it out of reveal animations and rendering essential content in HTML instead of waiting for JavaScript.
Those are high-value checks, not universal diagnoses. Confirm which element becomes LCP on each important template and which interaction creates poor INP before changing the theme.
Start by identifying the actual LCP element in a representative mobile lab trace. On a product page it is often the first product image; on a campaign landing page it may be a heading, banner or video poster.
Check the chain that must finish before that element appears:
Fix the longest avoidable step. Preloading every image or forcing every asset to high priority creates new competition and can make the page worse. Reserve priority for the resource that is genuinely critical in the first viewport.
INP is not simply a page-load metric. It captures how long the page takes to respond visually after a shopper interacts.
Reproduce the interactions that matter commercially:
Then inspect long main-thread tasks, event handlers, layout work and third-party scripts around the delayed interaction. Common causes include multiple apps reacting to the same cart event, large JavaScript bundles parsed before they are needed, synchronous analytics work and components that rebuild too much of the page.
The solution may be code splitting, deferring non-essential scripts, reducing work inside the event handler or providing immediate visual feedback while an asynchronous request completes. Removing an app is only one option, and it should follow evidence.
Layout shifts often come from content whose space was not reserved before it loaded:
Record the shifting element and the element that caused it. Those are not always the same. Reserve dimensions, keep late content out of an already-painted region where possible, and test real variant and localisation states—not only the default product.
Build a release timeline before blaming the theme, hosting platform or an app category. Shopify's performance tooling can expose events such as app installs and theme publications alongside real-user metrics. Add your own log for consent changes, tracking tags, experiments, promotional bars and large media updates.
For each regression, document:
| Evidence | Example question | | --- | --- | | Start date | Did the metric move immediately or gradually? | | Affected segment | Mobile product pages, all pages or one market? | | Release event | Which theme, app or tag changed nearby? | | Reproduction | Can the issue be triggered in a duplicate theme? | | Commercial function | What revenue or customer need does the feature support? | | Safer alternative | Can it load on interaction, after consent or on fewer templates? |
This prevents a destructive “remove every app” exercise that improves a lab score while deleting reviews, subscriptions, merchandising or measurement the business depends on.
Consider a synthetic Indian D2C store with 100,000 mobile sessions over 90 days. Product pages receive 52% of sessions, collection pages 24%, the home page 14% and content or campaign pages 10%.
The illustrative field dashboard shows:
| Segment | LCP | INP | CLS | Commercial context | | --- | ---: | ---: | ---: | --- | | Mobile product pages | 3.4 s | 180 ms | 0.08 | Highest traffic; LCP needs improvement | | Mobile collections | 2.3 s | 410 ms | 0.06 | Filters and quick add respond slowly | | Mobile home page | 2.1 s | 170 ms | 0.19 | Promotional modules shift after load | | Desktop product pages | 2.0 s | 140 ms | 0.05 | Good; lower priority |
The first sprint should not “optimise site speed” generally. It should test three specific diagnoses: product-image discovery for LCP, filter-handler work for INP and reserved space for the home-page promotion.
Suppose the store has a 1.8% mobile conversion rate and ₹1,900 average order value. The Conversion Rate Calculator can show the revenue associated with an observed change, but it cannot prove the performance release caused that change. Promotions, traffic mix, stock and pricing may have moved at the same time. Use an A/B test or staged rollout where feasible, and report correlation honestly where it is not.
Google says its core ranking systems use Core Web Vitals, but its page-experience guidance also says good report scores do not guarantee top rankings. Relevant, helpful content can outrank a faster but less useful page.
For commerce, performance can remove friction from product evaluation and checkout progression. That makes speed a conversion-quality input, not a guaranteed revenue lever. Track by page type:
The CRO glossary provides the shared definition. HML's Shopify GA4 audit explains how to validate commerce events, while the Shopify Checkout Extensibility audit covers checkout-adjacent changes that can affect both measurement and experience.
For implementation context, review the Shopify analytics and GTM case study. Its results are specific to that engagement and are not evidence for the synthetic example above.
Week 1: establish evidence. Export 90 days of mobile and desktop field data by page type. Annotate releases, app installs and campaign changes. Select the three highest-exposure failures.
Week 2: reproduce and isolate. Run repeated mobile lab tests on representative URLs, capture the LCP element and slow interactions, and test suspected changes in a duplicate theme.
Week 3: release narrowly. Ship one measurable change at a time with a rollback path. Confirm analytics, consent, merchandising and accessibility still work.
Week 4: verify and decide. Review lab traces immediately for regression, then keep monitoring field data through a representative traffic window. Compare conversion metrics with a documented caveat unless the release used a controlled experiment.
If the store has conflicting scores, unexplained mobile regressions or an overloaded app stack, request a Shopify performance and CRO audit. HML's website development service connects theme engineering, analytics and conversion priorities in one remediation backlog.
Reviewed by rajkumar-tahalani on 15 September 2026. Access dates are shown for time-sensitive references.

Website Development
Shopify Checkout Extensibility Audit for Indian D2C Brands

Website Development
Is Your Shopify Store Ready for AI Shoppers? AEO Checklist for Indian D2C Brands (2026)
Free Tool
AOV Calculator
Find your average order value and its upside.
Case Study
4.5x Total ROI
How a Premium Bespoke Tailoring Brand Achieved 4.5x ROI Across Digital Channels
We help Indian D2C brands grow with performance marketing, AI automation, and AEO-ready content. Book a free strategy call and we'll show you where the biggest wins are.