Loading Howl Media Labs
Preparing the page and animations...
Loading Howl Media Labs
Preparing the page and animations...
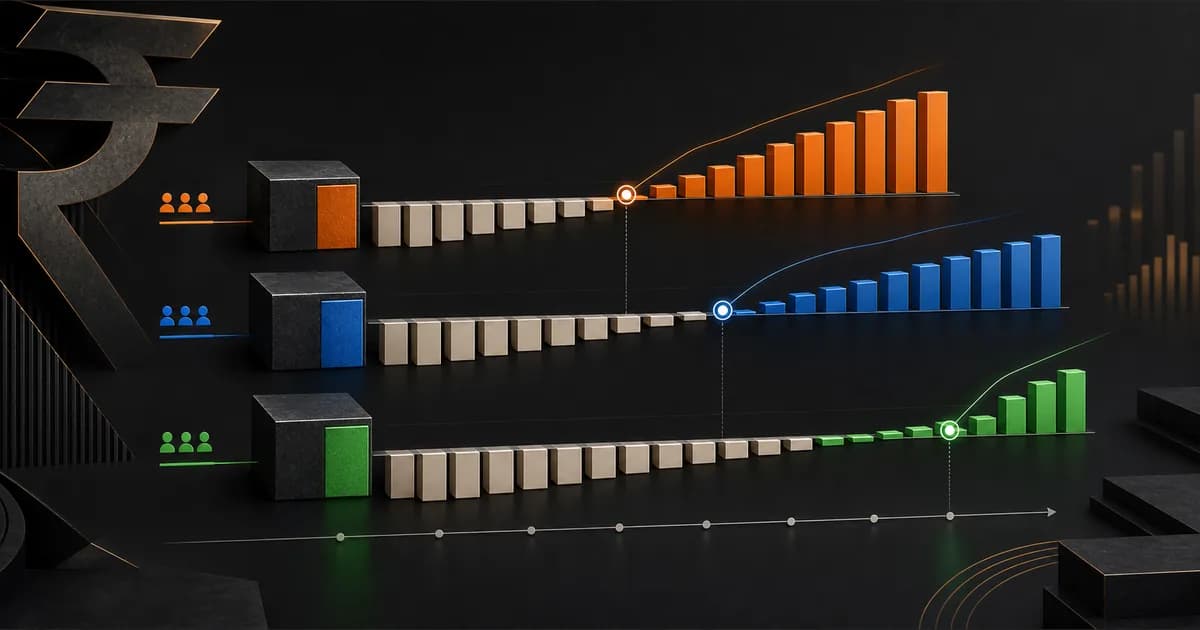
Calculate LTV:CAC and CAC payback by acquisition cohort, not only as a blended account average. Assign acquisition cost to new customers, accumulate realized gross profit after discounts, returns and direct costs, and identify when each cohort recovers CAC. Compare channels only at the same cohort age, then use observed retention before relying on forecast lifetime value.
The ratio answers “how much value might this customer group create relative to what it cost to acquire?” Payback answers the harder cash question: “how long until we earn that acquisition cost back?”
Use two separate equations:
LTV:CAC = margin-adjusted lifetime value per acquired customer ÷ CAC
CAC payback = the first period when cumulative gross profit per acquired customer equals or exceeds CAC
For a stable subscription business, a simplified payback formula can divide CAC by monthly gross profit per customer. Most product-led D2C brands do not have smooth monthly revenue or churn. They have first orders, discounts, repeat-purchase windows, partial returns and category-specific replenishment cycles. In those cases, observed cohort cash flows are more useful than pretending every month behaves the same.
Shopify's August 2026 CAC payback guide also defines payback as the time required to recover customer acquisition cost from gross profit. That distinction matters: revenue is not the cash available to repay CAC.
4.5x Total ROI
See how a bespoke tailoring brand hit 4.5x total ROI across channelsRead it →
A blended ratio can combine:
The resulting number may be mathematically correct and commercially useless.
Suppose the brand's blended LTV:CAC improves this month. That could mean recent acquisition became more efficient. It could also mean an older cohort produced a seasonal repeat-order spike while current CAC deteriorated. A budget decision needs the acquisition cohort and its age, not only the account average.
The LTV glossary entry gives the basic definition. The operating upgrade is to calculate it at the level where the budget decision is made.
Start with customers whose first completed order falls in the same week or month. Then add decision-relevant breakdowns.
| Cohort field | Why it matters | | --- | --- | | First-order week or month | Establishes a common age for comparison | | Acquisition channel or campaign group | Connects customer quality to spend decisions | | First-order offer | Separates full-price buyers from discount-led acquisition | | First product or category | Reveals different replenishment and margin patterns | | New-customer definition | Prevents returning or guest-identity duplicates from entering CAC | | Geography | Captures shipping, COD, return and delivery-cost differences |
Do not create so many segments that every cohort becomes statistically empty. Begin with acquisition month and channel, then split only when the commercial hypothesis justifies it.
Google Analytics cohort exploration can group users by first touch, event, transaction or conversion and show their behaviour across daily, weekly or monthly periods. Google also notes that these cohorts are based on device data and do not use User-ID. That makes GA4 useful for directional behaviour analysis, but not a replacement for reconciled customer and finance data.
At minimum, make the numerator visible:
Then divide by reconciled new customers, not platform-attributed purchases.
Keep shared brand investment and overhead in a separate view if allocation would be arbitrary. The aim is not to force every rupee into one formula. It is to stop presenting media-only CAC as fully loaded CAC.
The CAC Calculator can check the arithmetic. Document what is included before comparing its output across teams.
Use cumulative realized gross profit or contribution value per acquired customer:
Order revenue
minus discounts, refunds and returns
minus product and other direct costs included in the brand's margin definition
Do not switch definitions between cohorts. If fulfilment, payment fees or COD losses are excluded, state that clearly.
Shopify's 2026 customer acquisition model recommends a margin-adjusted CLV for profitability analysis and notes that channel-level customer quality can change the budget conclusion. Its CLV guide provides the familiar average-order-value, purchase-frequency and lifespan model. That formula is a forecast. A cohort curve shows what customers have actually produced so far.
Consider a fictional Indian D2C nutrition brand. Both cohorts cost ₹1,000 per new customer and generate ₹1,500 of six-month gross profit per customer. The figures are synthetic.
| Cohort age | Cohort A cumulative gross profit | Cohort B cumulative gross profit | | --- | ---: | ---: | | First order | ₹700 | ₹250 | | End of month 1 | ₹950 | ₹500 | | End of month 2 | ₹1,100 | ₹750 | | End of month 3 | ₹1,250 | ₹1,000 | | End of month 4 | ₹1,350 | ₹1,250 | | End of month 5 | ₹1,425 | ₹1,400 | | End of month 6 | ₹1,500 | ₹1,500 |
At month six, both cohorts have:
Observed six-month LTV:CAC = ₹1,500 ÷ ₹1,000 = 1.5×
But the cash timing differs:
If the brand is cash constrained, Cohort A can support faster reinvestment even though both six-month ratios are identical. If Cohort B has stronger month 7-12 retention, its eventual lifetime value may still be higher. The decision should show both observed payback and forecast upside.
Methodology: CAC includes the acquisition cost assigned to reconciled new customers. Cumulative value is realized gross profit after discounts, returns and direct product costs. No overhead, tax or financing cost is included. Teams should replace these assumptions with their own finance definitions.
Use HML's LTV:CAC and CAC Payback Calculator for a quick scenario. Its churn-based LTV model is better suited to recurring revenue. For non-subscription ecommerce, replace the forecast with the observed cohort curve shown above.
Compare the same age:
Do not compare a January cohort's six-month value with an August cohort's first-month value. Use a triangular cohort table where each row is an acquisition month and each column is cohort age.
Also align:
Translate the cohort into a budget rule.
| Pattern | Likely decision question | | --- | --- | | Low CAC, weak repeat margin | Is the offer attracting low-quality first orders? | | High CAC, fast payback | Does high first-order margin justify scale? | | Strong forecast LTV, slow observed payback | Can cash runway support the delay and forecast risk? | | Fast payback, low ultimate value | Is the channel useful for cash efficiency but limited for long-term growth? | | Strong ratio driven by one product | Will product mix remain available and profitable at scale? |
The MER guide covers blended business efficiency, while the incrementality guide addresses whether media caused additional outcomes. The creative-fatigue framework helps diagnose a deteriorating ad before its acquisition cohort is mature.
A brand can have acceptable MER and still acquire poor cohorts. It can also have an attractive cohort ratio while cash is trapped in slow payback. These metrics answer different questions and belong together.
For each acquisition month and channel, report:
The plant gifting performance case study illustrates why category and higher-value customer segments should be separated rather than hidden inside one blended acquisition result.
Choose the last six complete acquisition cohorts, reconcile new customers and direct margin, and calculate cumulative value at the same cohort ages. Do not change budgets from a single forecast ratio. Identify the channel with the strongest observed payback, then test whether it retains the same economics as spend increases.
If finance, Shopify and paid-media reports cannot agree on cohort CAC or retained margin, request a cohort unit-economics review. HML's performance marketing service can connect acquisition planning to margin, retention, payback and cash constraints before the next scale decision.
Reviewed by rajkumar-tahalani on 2 September 2026. Access dates are shown for time-sensitive references.

Performance Marketing
Google Ads New Customer Acquisition Audit for Indian D2C Brands

Performance Marketing
Google Demand Gen 2026: Messaging, Creative and VTC Measurement for Indian D2C
Free Tool
ROAS Calculator
Measure your return on ad spend in seconds.
Case Study
4.5x Total ROI
How a Premium Bespoke Tailoring Brand Achieved 4.5x ROI Across Digital Channels
We help Indian D2C brands grow with performance marketing, AI automation, and AEO-ready content. Book a free strategy call and we'll show you where the biggest wins are.
Or See how a bespoke tailoring brand hit 4.5x total ROI across channels.